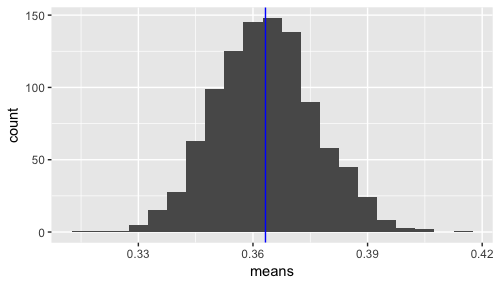
I’ve been reading up on Markov chains and related concepts. On the wikipedia page there is an example of a 2 state Markov process. I decided to simulate it in R and plot the mean of the means.
Quick Code example here:
The mean of means (of state e) is close to .36. If you take .3 * .36 + .4 * (1-.36), you get .364, so this seems to make sense. Note that I’m weighting the switching to e percentage based on the percentage of being in that state in the first place.
